09 Nov Data Sounds: The Music of Statistics
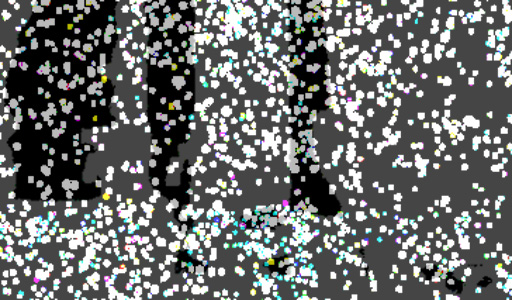
INSTRUMENT: One Antarctic Night is a suite of data instruments that use data from hundreds of thousands of stars captured by robotic telescopes in Antarctica. The interactive‚ and immersive aesthetic data experience will provide visitors the opportunity to explore characteristics of the stars seen above the South Pole through responsive sound‚ movement‚ graphics and visualization.
To create sound for INSTRUMENT‚ the team is developing new paradigms‚ working in a blended space between practices of data sonification and computer-assisted composition to create a conversation between traditional practices‚ contemporary digital music and working with new mediums‚ new methods‚ and new theories.
The interaction system they are creating will represent the diversity of the dataset with diversity in sound. For instance‚ as they collect statistical metadata about the stars‚ the INSTRUMENT team
determines how to use those statistics to drive the system’s audio‚ with human interaction as a medium.
“We are asking what structure the data represents and then modeling the music off that structure while accounting for how the user engages and manipulates the data‚” says composer Zach Thomas. He notes that projects of this scale require working closely with computer scientists‚ and artists in other mediums.
The project uses multiple types of programming environments‚ some of them specifically designed for building music-based‚ media-art projects. Musicians‚ artists‚ and computer scientists are working together to build data management‚ visual rendering‚ and audio synthesis tools that successfully work together in an interactive system that visitors can experience and enjoy.
The INSTRUMENT project is tailored to encompass series of statistical processes by which astronomers understand their data. It also fosters new conceptual insights that can be found outside scientific methods‚ in abstraction of the data and the ability to focus in or zoom out. The sound they are creating represents not only the data‚ but these abstractions as well.
How Data Sounds
Data sonification is the process of assigning sound to patterns in the data so its various parameters can be understood in a context that is true to the raw material but fluid in its notation. The more parameters involved‚ the richer the soundscape that can be created. The team is looking for statistical patterns in the data that might reveal new insights about how sound can express what we can’t see about data.
 In order to create a working system that still involves the rich extent of the dataset‚ the team must map statistical distributions in the data onto distributions in the sound.
“It would be nice if we could allow the data to move‚ to flow along with time‚” says musician Ermir Bejo‚ talking with scientists in Chile‚ Dallas‚ and Bryan‚ Texas about the project.
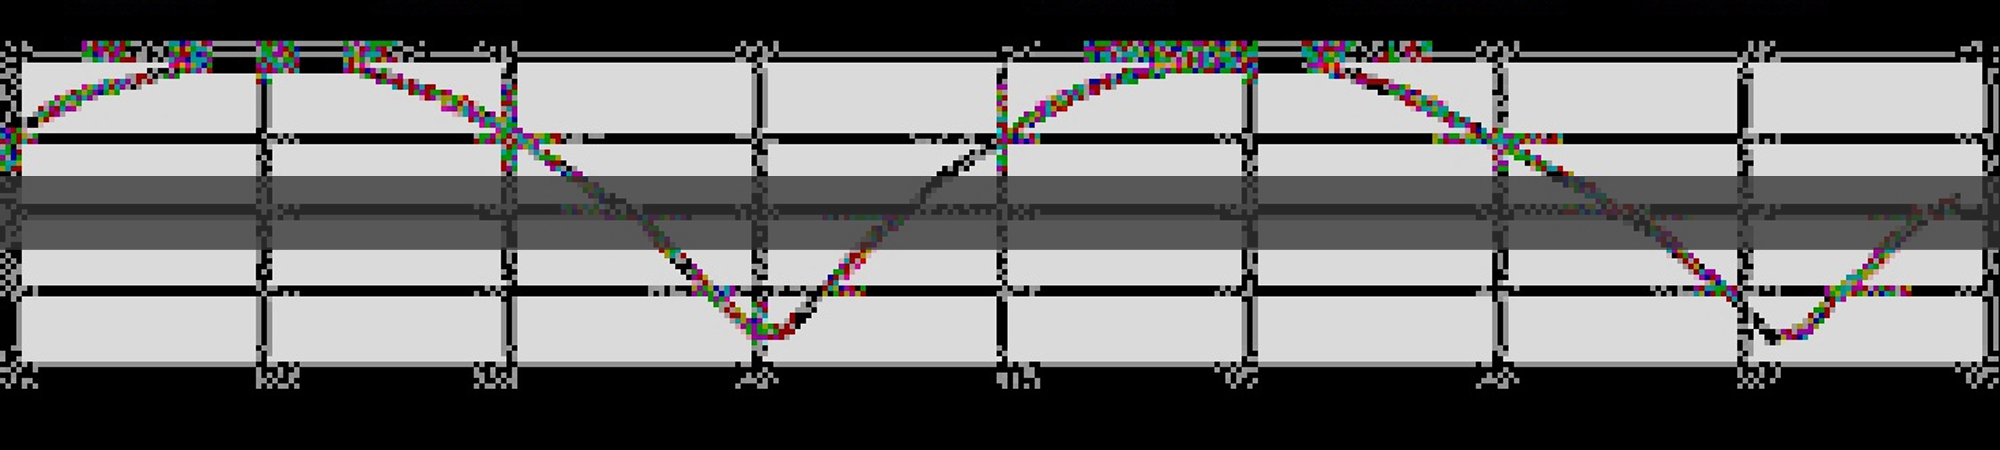
Time is one factor in the data. Variability is another. Light intensity‚ star type‚ and distance are all parameters the team is working with in order to communicate the data through interactive experience. They use the data itself‚ visual renders of data‚ and graphical representations such as light curves to translate the data into sound and create interactive components.
Learn more about the project: “The Data Wranglers: Cataloging the Night Sky“